This month we welcome guest contributor and industry expert, Pete Smith of C&S Associates. Pete’s spent much of his life evaluating apparatus repair shops and knows what it takes to make one profitable.
Apparatus service company sales derive mainly from payroll hours charged to billable jobs.
Apparatus service company costs derive mainly from payroll hours paid.
Therefore, the more payroll hours charged to jobs, the greater the company’s profits.
While this syllogism is oversimplified, it is the foundation of every apparatus service business. However, the comparison of hours charged to jobs compared to total payroll hours – a key measure of productivity – is often overlooked by many small to medium-sized apparatus service companies.

Start with the hours
Whether electrical, mechanical, electronic, or other trades: in-shop or in the field, the basic unit sold is labor hours. Management reports in these small to medium businesses often jump right to the dollars of sales and costs, without considering the underlying hours that create the sales dollars.
The simple model constructed below shows how keeping track of hours and productivity is useful in managing a service business and can lead to better, more profitable decision making about staffing levels, management efficiencies, and company policies.
This model is for a small to medium sized shop. Payroll hours include the owner, one salesperson, three office personnel and fifteen shop employees, including the foreman.
Productivity Model
Column Headings and Definitions for the table below
- Week Number (Wk): Weekly is the typical pay period for hourly workers. The week number begins with the first pay period of the year and rolls up to 52 weeks before starting again.
- Date (Date): The Pay period ending date for that week.
- Number of Employees (Emp): The number of employees at the pay period ending date.
- Payroll Hours (PayHr): The total number of hours paid through payroll. For exempt and salaried employees, 40 hours per week is typically used.
- Productive Hours (ProHr): Hours of shop or field labor charged only to billable jobs. Also includes exempt and salaried hours charged to billable jobs for such activities as engineering, job or project management, on-the-job-site overnight pay, and special purpose pickup and delivery. Excluded hours include: shop maintenance, come-backs, safety meetings, training, or other non-billable, non-policy time off activities.
- Productivity: (Pro%): Divide the productive hours (ProHr) by the total payroll hours (PayHr). Expressed as a percentage.
- Overtime Hours (OTHr): Number of payroll hours paid at overtime rates.
- Overtime Ratio (OT%): Divide the overtime hours (OTHr) by the payroll hours (PayHr). Expressed as a percentage.
- Policy Time Off Hours (PtoHr): Hours that are paid, but, by company policy, are not productive: vacation, holiday, bereavement, new baby, other.
Model – One Week Here is what the model looks like for week 17.
![]()

Number and type of hours are used to calculate productivity percentages and profitable hours.
The model indicates the 20 employees were paid 927 hours in week 17. There were 561 hours charged to jobs and 102 hours of overtime.
The productivity was 61%; i.e., of the total hours paid for the week, 61% were charged to billable jobs. Overtime was 11% of the hours paid, and 49 of the hours paid were for policy time off.
One-week figures alone do not reveal much information that would prompt management action. The more important information is derived from looking at the trends.
Model – 10-weeks
Here is week 17 tucked in the 10-week period ending 5/22.
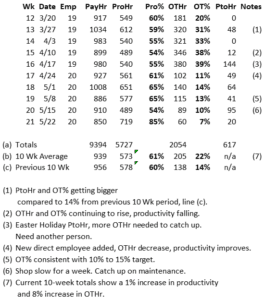
Results
Week to week changes are monitored and explanatory notes (1-6) or conversations should be tracked for both the positives and the negatives.
Line (a) above shows the totals for the 10-week period. Line (b) shows the averages for the 10-week period. And, Line (c) shows the averages for previous 10-week period ending 3/13, note 7, indicating a 1% increase in productivity.
Is a 1% change in productivity, plus or minus, important?

Assume the average cost per hour for all the payroll hours including all fringe benefits is $40. Assume the average billing rate for a charged hour is $100. The incremental margin is $60 per hour for each additional hour charged to jobs. A productivity change of 1% of the average hours per week is roughly 9 hours. Those hours multiplied by the additional margin results in a margin change, plus or minus, of $540 per week or $28,000 per year. Taking this one step further, assume the company does $4,000,000 in sales with a 7% pre-tax income, or $280,000. A 1% change in productivity will increase or decrease the annual pre-tax income by 10%.
Capital Expenditures
In addition to replacing worn out equipment, many capital expenditures are made to improve productivity.
To take the prior analysis another step, assume that a new piece of equipment cost $28,000 and would increase productivity by 1%. This one-time investment would pay back in one year and yield a $28,000 profit improvement for every additional year in use.
Budgeting
When planning future budgets, start with the hours of service and repair that your salespeople forecast they can sell for a year. Then translate that to dollars based on average billing rates overall or by department. Having some indication of the hours planned for next year, will indicate what changes are needed in staffing levels.
What about OTHrs and OT%?
Whether overtime is good or bad depends on how many of the overtime hours are created by rush jobs that get a premium hourly billing rate. If the OT premium billing increases by the same 50% increase as time and a half overtime pay, these are good hours – margins increase significantly. Overtime hours needed to cover manpower shortages on non-rush jobs, comebacks, and maintenance are expensive hours.
However, many service companies build in a certain amount of overtime in their budgets even if the overtime does not create premium billing. Some employees appreciate the opportunity to work overtime for the extra money. Judicious use of overtime allows companies to increase or decrease the number of productive hours available without the additional cost of adding a new employee and the related fringe benefits. In the model above, the OT% was over the companies target range for a long enough time to justify adding a new employee.
Paid Time Off
Policies for paid time off hours vary from company to company. No averages are calculated as the number of paid time off hours varies by holiday and vacation schedules. And sick, bereavement, or other paid time off can arise at any time. It is important to look at the total hours provided by company policies and used each year.
For our model, assume the following: 900 hours per week of payroll hours, or 48,600 per year. If there are eight paid holidays, an average of twelve days of vacation, and each employee uses 4 days of other policy time off, that results in 3,840 hours which means almost 8% of total payroll hours are automatically unproductive. Using the prior cost of $40 per hour, the result is a cost of $153,600 in policy time off. If the company were to add one additional holiday that would create an additional 160 hours of non-productive time at an approximate cost of $6,400. Paid time off is customary and a cost of doing business. Good paid time off policies results in better morale and productivity. Management just needs to know the cost of paid time off in making future budgets.

Variations
New Product Sales
Most service companies also sell out-of-the-box new products when the repair vs. replace decision favors a replacement. Since the sale was created because of the company having the ability to repair the unit, there is no reason to exclude part or all the hours of personnel working on replacement sales. However, if a separate sales department is maintained for OEM or Internet product sales, then those personnel might be excluded.
Level of Detail
For larger companies, separate models might be generated for each department manager: winding, machining, field service, etc. Companies with separate branches might generate a separate model for each branch.
Time Frame
Some companies may prefer to view the model for periods different than 10 weeks: monthly, quarterly, or even annually.
Other Measures
Other ways to look at the data might be to include the productive hours per employee and the overtime per employee.
Summary
This simple model tracks only four variables: total payroll hours, productive hours, overtime hours and paid time off hours. Nevertheless, the model yields important decision-making information that managers may use to improve performance and profitability. The absolute hours and percentages are not as important as the trends and the explanations of the changes, good or bad.
Each company will have different productivity and overtime percentages depending on mix of business and staffing levels. Variations to this model can be made to fit the size of a company and the needs of management.
Granted the analyses made above regarding the profit impacts of changes in these measures are hypothetical and basic; but the fundamentals are solid and can be adapted to real world situations – and you can take that to the bank!

About the Author: Pete Smith has served owners of electrical apparatus service companies for four decades. He specializes in profit analyses, business valuations, family succession, and business sales.
For a copy of the Excel spreadsheet used in the example, email petesmith@value-a-business.com or call him at 205-837-4845.